Association between prostate-specific antigen density and prostate cancer prediction among Nigerian men
1Emmanuel Kunle Abudu, 2Cecilia Ndiuwem Okuku, 3Okon Edet Akaiso, 2Unyime Aniekpon Fabian, 3Elijah Asuquo Udoh, 3Albert Effiong Ukpong, 4Ikwo Jonathan Kudamnya, 4Oyedele Oyewunmi Ajayi, 5Felix Uduma Uduma, 6Oluwasayo Omolara Abudu, 1Boniface Okon Ekpo
Abstract
Background: Prostate - specific antigen density (PSAD) has been shown as a valuable diagnostic and predictive tool for prostate cancer.
Objectives: To ascertain the utility of PSAD in predicting prostate cancer in patients with PSA > 4 .0 ng/ml.
Subjects & Methods: The study was an analytic cross-sectional study comprising 382 patients at the University of Uyo Teaching Hospital with PSA levels of > 4.0 ng/ml and normal or abnormal digital rectal examination findings. PSAD was computed and transrectal ultrasound guided prostate biopsies were performed. Statistical analysis was done using a statistical package for social sciences version 24 (SPSS, IBM, Chicago, IL, United States). Appropriate test statistics including mean, standard deviation, Chi-square, t-test, Fischer’s exact test, Pearson’s r-test) with p-value < 0.05 considered as significant.
Results: The mean age for all the patients was 55.7 + 2.6 year while the mean ages of 52.9 + 3.3 years and 65.1 + 11.3 years were for patients with benign and malignant prostate diseases respectively. 26.2 % were adenocarcinomas. The mean and median of PSAD for prostate cancer were 0.31 + 0.23 and 0.31 ng/mL/cm3 respectively. PSAD had positive predicting association with prostate cancer risk (p=0.004) using univariate logistic regression. The Area Under the Curve (AUC) and optimal cut-off point for the PSAD was 0.9 (95% CI: 0.83–0.97) and 0.052 respectively, indicating strong diagnostic performance for predicting prostate cancer. PSAD showed statistical significance in cancer detection (p < 0.001) with a detection rate, sensitivity and false positive rate of 90.0 %, 85.0 % and 8.0 % respectively.
Conclusion: A PSAD of 0.052 ng/ml/cm3 can be used as a cut-off value to predict prostate cancer when evaluating patients with raised PSA in our population.
Keywords: Prostate prostate-specific antigen density; predictor, Prostate cancer.
Introduction
Prostate cancer (CaP) remains the most common cancer in men and still challenged with late presentation in some countries.1,2 Digital rectal examination (DRE) is still a valuable tool in the diagnosis of prostate cancer and shows enlarged nodular, hard to craggy prostate with obliterated median groove and sulci as well as fixed rectal mucosa suggestive of suspicious for prostate cancer.3-17 Serum prostate-specific antigen (PSA) estimation has been used to predict men who at risk of prostate cancer and determine the choice of medical treatment in benign prostatic hyperplasia (BPH).4,6,7,9,18-23 However, usefulness of PSA is limited by its potential risk of false positivity or negativity that may be associated with over-diagnosis, under-diagnosis, and overtreatment of prostate cancer as well as other prostatic lesions such as urinary tract infections, benign prostatic enlargement (BPE), acute and chronic urinary retention, and prostatic trauma from a trucut diagnostic biopsy or vigorous digital rectal examination may produce raised serum PSA.18,24
It is also pertinent to highlight the role of transrectal ultrasonography (TRUS) of prostate in increasing the detection rate of prostate cancer among other mimicking prostatic lesions alongside other complimentary diagnostic tools including transrectal ultrasound guided prostate biopsy, PSA and DRE.3,6,25
It has been documented that prostate specific antigen density (PSAD) is a better predictor of prostate cancer than PSA but its applicability is often challenged by infrequent utilization in day to day clinical practice over the years.26-31,32 Furthermore, PSA-density might inform biopsy decisions, and spare some men from the morbidity associated with a prostate biopsy and diagnosis of low-grade prostate cancer as well as being used as an important active surveillance tool for low-risk prostate cancer requiring radical treatment at a long-term follow-up.2,33-49 A study in 2020 highlighted the role of PSAD in distinguishing malignant and benign prostatic diseases especially in patients with grey zone of 4.0-10.0 ng/ml as PSA wherein only 25.0 % of the cases are diagnosed to have cancer, while remaining 75% undergo unnecessary biopsies, thus preventing unnecessary biopsies.1 They also showed that PSAD is statistically significant in cancer detection (p <0.001) with a detection rate, sensitivity and specificity of 51.5%, 89.5% and 69.8% respectively as well as a higher sensitivity (95%) at a cut-off of 0.12, indicating the usefulness of PSAD in prostate cancer detection among men with PSA 4-10 ng/ml.1 This study is designed to ascertain the utility of PSAD in predicting prostate cancer in patients with normal or abnormal DRE findings and PSA > 4.0 ng/ml as well as to evaluate how effective these variables are in predicting severity of prostate cancer in terms of Gleason score and grade group.
Materials and methods
Study design and duration
Hospital-based cross-sectional study for diagnostic test evaluation of male participants aged 40 years and above with or without symptoms suggestive of obstructive uropathy, normal or abnormal DRE and elevated serum PSA (> 4.0 ng/ml). The study duration was for a period of 4 months from September to December 2024. The participants were seen at the Urologic Clinics in University of Uyo Teaching Hospital and those ready to undergo all recommended phases of the clinical, laboratory and radiological assessment were the target population. Informed consent was obtained from all eligible patients. All demographic data and findings of clinical and physical examinations were documented. Five milliliters of blood samples for PSA were obtained between 08.00 and 10.00 hours in a plain bottle from the participants, centrifuged at 5000 Revolutions per minute and frozen at -20oC within 2 hours of collection prior to analyzing in the laboratory. Assays for PSA were conducted in three batches for all the samples using an ELISA kit (C-bios Perfemed Inc, California, USA). The result was read using a microtitre-well reader. Immunoassay quality control sera (Biorad, Hercules, CA, USA) were used to monitor the precision of the results. Digital rectal examinations and transrectal ultrasonography of prostate gland were conducted on the patients and their findings documented in the in the proforma designed for the study.
Prostate specific antigen density (PSAD) was computed by dividing PSA levels with prostatic volume obtained from transrectal ultrasonography of prostate gland. Biopsy procedure was performed with acceptable 12-core prostate biopsies (from right and left lateral right and left paramedian regions in base, mid zone and apical region of prostate) on out-patient basis. The 12-core biopsy specimen was sent for histopathological assessment. The histopathologic report was categorized as benign and malignant. Malignant (adenocarcinoma) was subcategorized as grade groups (Grade group 1 to grade group 5) based on Gleason score. This was used to assess severity of malignancy and find out any relationship with PSAD.
Sample size
The sample size was estimated using the formula.50
N = Z2pq/d2
where p is derived from the study done in Lagos which is 1.046.5
N = sample size
Z = standard normal deviation set at 1.96 (95% C.I)
q= 1-p (1-0.01046)
d= degree of accuracy (set at 0.02)
(1.96)2x 0.01046 x 0.98954/0.01 x 0.01
= 397.6 rounded up to
= 400
Inclusion criteria
The study included participants who are aged 40 years and above with or without symptomatic obstructive uropathy, normal or abnormal DRE and elevated serum PSA (> 4.0 ng/ml), who were willing to participate in the study and signed the informed consent form.
Exclusion criteria
The study excluded patients on medications known to lower PSA (fiuasteride or dutasteride), receiving anticoagulant therapy, who had an indwelling Foley catheter, a symptomatic or asymptomatic urinary tract infection, bleeding disorders, acute prostatitis before prostate biopsy and previous prostatic biopsy or prostate surgery as well as those with contraindications to transrectal ultrasonography such as peri-anal infections and haemorrhoids.
Statistical analysis
All statistical procedures were performed using a statistical package for social sciences version 24 (SPSS, IBM, Chicago, IL, United States). All quantitative variables were expressed in mean and standard deviation while qualitative variables were expressed in percentages. Inferential statistics (Chi-square, t-test, Fisher’s exact test, and Pearson’s r-test) were utilized for exploring the association between two or more variables. Cl of 95 % was used while p< 0.05 was considered statistically significant. Univariate logistics analyses were performed for each independent variable and outcome. A multivariate logistic regression analyses was used to estimate adjusted odds of outcome after controlling for demographic characteristics, comorbidities, hospital teaching status, and potential confounders. Receiver operating characteristic (ROC) curves were plotted as sensitivity versus 1- specificity for PSAD outcome. A receiver operator characteristic (ROC) curve analysis was used to evaluate the properties of the PSAD as a predictor of prostate cancer risk and identify an optimal cutoff point for the test in this particular study population.
Ethical consideration
Ethical approval to conduct the study was obtained from the Health Research and Ethics Committee of the University of Uyo Teaching Hospital (NHREC/24/06/UUTH/AD/S/96/VOL.XXI/929) before commencement of the study.
Informed Consent: Written informed consent was obtained from all participants before embarking on the study. Brief education on the purpose and nature of the study was given to all participants. This involved providing a clear and comprehensive explanation of the research objectives, procedures involved, potential risks and benefits of participation. Participants had ample opportunity to ask questions and clarify any doubts before deciding to participate. By ensuring informed consent, the researcher respects participants’ autonomy and allows them to make well-informed decisions about their involvement in the research.
Confidentiality: All participants were assigned a unique code to ensure confidentiality. Only the lead researcher had access to the information linking the identity of the studied participants to the study codes to ensure anonymity and prevent stigmatization. Participants were reliably informed that the information provided shall be strictly kept secret.
Justice: The recruitment process was designed to avoid any bias towards specific demographics or populations. Participation was open to those who meet the inclusion criteria, regardless of background or affiliation. By ensuring fair recruitment and balanced reporting, the research contributes to a more just and equitable understanding of the topic under investigation.
Beneficence: Measures were taken to minimize any potential risks of physical, psychological, moral, or reputational harm. Participants were informed of any potential benefits of participating, such as contributing to scientific advancements or gaining a deeper understanding. By minimizing risks and maximizing potential benefits, the research adhered to the principle of beneficence.
Voluntariness: Participation in the study was entirely voluntary. No coercion or undue pressure will be exerted on potential participants. Participants were free to withdraw from the study at any point without repercussions. The researcher avoided any recruitment strategies that could be perceived as manipulative or exploitative. By ensuring voluntariness, the research respects the autonomy and decision-making rights of participants.
Nonmaleficence: Non-maleficence is the obligation of a researcher not to harm the participant. This simply stated principle supports several moral rules - do not kill, do not cause pain or suffering, do not incapacitate, do not cause offense, and do not deprive others of the goods of life.
Results
Sociodemographic characteristics
A total of 400 consecutive men were invited, of which 382 (95.5%) with ages ranging from 40 to 89 years were screened. The mean age for all the participants was 55.7 + 2.6 years. 257 (67.3%) participants were >50 years of age, with the 50–59 years of age group having the highest frequency (34.8%) [Table 1]. The mean, and median ages as well as 95% Confidence interval for participants diagnosed of prostate cancer were 65.1 + 11.3 years, 64 years and 62.9 - 67.4 years respectively. The mean, and median ages as well as 95% Confidence interval for patients diagnosed of benign prostate disease were 52.9 + 3.3 years, 51.2 years and 49.2 - 55.1 years respectively.
Table 1: Shows Age distribution and Type of Prostate disease (benign and malignant) among the participants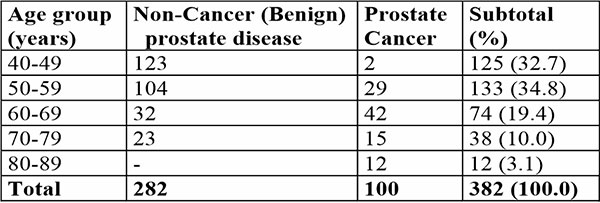
Prevalence, histological characteristics and grading of prostate adenocarcinoma
A total of 382 prostate tissue samples were biopsied. Of this number, 282 (73.8%) were benign lesions, while 100 (26.2 %) were carcinomas giving a carcinoma frequency of 26.2 %.
All the prostate cancer cases were adenocarcinoma. Of the men with adenocarcinoma, 95% had clinically significant prostate cancer, the International Society for Urological Pathologists/World Health Organization (ISUP/WHO) grade group = 2 (Gleason score = 7) while the remaining 5% of participants had clinically insignificant prostate cancer featuring low grade adenocarcinoma characterized by ISUP/WHO grade group 1 and Gleason score of <6. Majority of patients with adenocarcinoma presented with a very high-grade tumour indicated by ISUP/WHO grade group 5 and summated Gleason score of 9 (n=47, 47.0 %), ISUP/WHO grade group 4 and summated Gleason score of 8 (n=17, 17.0 %) and ISUP/WHO grade group 5 and summated Gleason score of 10 (n=7, 7.0%). Some participants presented with intermediate grade tumour featuring ISUP/WHO grade group 2 or 3 and summated Gleason score of 7 (n=17, 17.0 %) The least grade characterized by ISUP/WHO grade group 1 and summated Gleason score of 5 was seen among 5 patients (5.0%).
Characteristics of Prostate Specific Antigen in the diagnosis of prostate cancer
The mean and median values of prostate-specific antigen (PSA) of participants with prostate cancer were 43.2 + 34.6 ng/mL and 36.0 ng/ml respectively with 95% confidence interval of 36.3-50.0 ng/mL. The majority (88.0%) of the participants with prostate cancer had serum PSA levels > 4 ng/mL. Majority of the participants had PSA values ranging from 31-40 ng/ml (22.0%). The PSA values >4.0–=10 ng/mL was seen in 6.0% of paticipants, values 11-20 ng/mL were seen in 9.0% participants, and values 21 - 30 ng/ml in 12.0 % of participants [Table 2].
Table 2: shows distribution of Prostate-specific antigen findings among participants with prostate cancer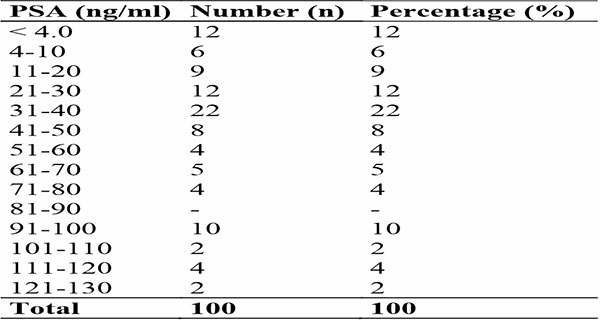
Characteristics of Prostatic Volume in diagnosis of prostate cancer
The mean and median values of prostate volume (PV) for participants with prostate cancer were 116.8 + 78.2cm3 and 98.0cm3 respectively with 95% confidence interval of 101.2 to 132.3cm3. Prostatic volume of 26.0-50cm3 and 76-100cm3 were the two most common prostate size estimation with each constituting 18.0%. The second leading prostatic volume ranged from 101.0 to 125.0cm3 were seen among 12.0 % of the participants.
Characteristics of Prostate Specific Antigen Density in diagnosis of prostate cancer
The mean and median of prostate-specific antigen density (PSAD) were 0.31 + 0.23 ng/mL/cm3 and 0.31 ng/mL/cm3 respectively with 95% confidence interval of 0.25 to 0.35 ng/mL/cm3. The majority (27.0%) of the participants with prostate cancer had serum PSAD levels of 0.01-0.10 ng/mL/cm3. The second and third highest number of prostate cancer participants had PSAD values of 0.31-0.40 ng/mL/cm3 (17.0 %) and 0.41-0.50 ng/ml/cm3 (16.0 %) [Table 3].
Table 3: Shows distribution of Prostate-specific antigen density (PSAD) findings among participants with prostate cancer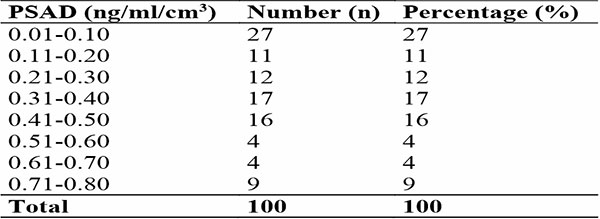
Relationship of the Prostate - Specific Antigen Density with grading of prostate adenocarcinoma
Table 4a evaluates the correlations between PSAD, and prostate cancer grading systems (Gleason Score and ISUP/WHO grade group). The PSAD shows weak negative correlations with Gleason grading score (r = -0.071) and ISUP/WHO grade group (r = -0.12), indicating minimal association with prostate cancer severity, and these relationships are not statistically significant. The ANOVA table 4b examines the variability of PSAD across Gleason scores, revealing a significant association for the PSAD (F-value: 6.83, p<0.001). The PSAD was highest for summated Gleason score of 10 (0.5 ± 0.18) and lowest for score of 8 (0.13 ± 0.15), with intermediate scores (5, 7, and 9) showing overlapping means. This indicates that the PSAD varies significantly with prostate cancer severity and may help to distinguish among Gleason scores.
Table 4a: shows Association between PSAD and the Grading system
Table 4b: shows Association between PSAD and Severity of Prostate cancer in relation to Gleason’ Grading Score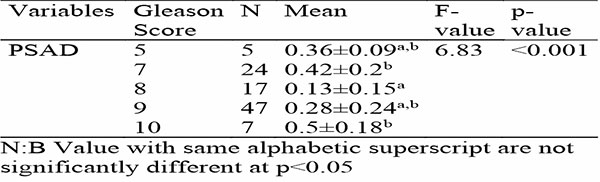
Table 4c: shows Association between PSAD and Severity of Prostate cancer in relation to ISUP/WHO Grade Group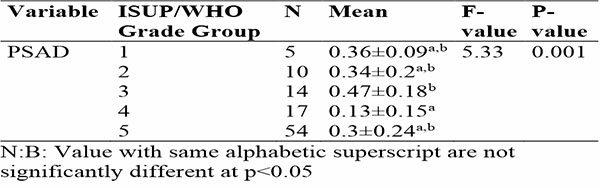
This ANOVA table 4c evaluates the relationship of PSAD with ISUP/WHO grade group of prostate adenocarcinomas, revealing a significant association for the PSAD (F-value: 5.33, p=0.001). For the PSAD, Prostate adenocarcinoma ISUP/WHO Grade Group 3 exhibited the highest mean (0.47±0.18), while Grade Group 4 had the lowest (0.13±0.15). Prostate adenocarcinoma ISUP/WHO Grade Group 1, 2, and 5 showed overlapping means (0.36±0.09, 0.34±0.2, and 0.3±0.24, respectively), as indicated by shared superscripts (a, b) in Table 4b. This suggests that PSAD varies significantly with cancer grade, with distinct differences between certain groups.
Prostate - Specific Antigen Density and Prediction performance for Prostate Cancer
Table 5 summarizes univariate logistic regression results for factors predicting cancer risk. Age (Odds Ratio [OR]: 1.10, 95% CI: 1.04–1.17, p=0.002) and PSAD (OR: 34.43, 95% CI: 3.07–386.82, p=0.004) were positively associated with prostate cancer.
Table 5: Univariate and Multivariate logistic Regression Analysis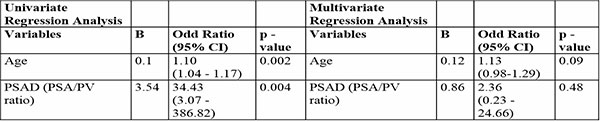
Multivariate analysis adjusts for interactions between variables. PSAD (OR: 2.36, p=0.48) was not statistically significant, confirming its non-protective effect. Age showed a trend toward significance (OR: 1.13, p=0.09), suggesting a complex interplay among these factors in predicting cancer risk (Table 5).
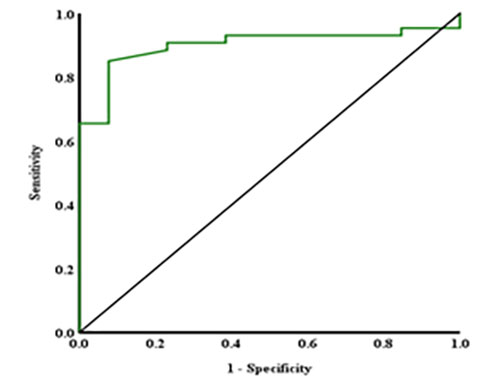
Figure 1: ROC curve for PSAD
A Receiver Operating Characteristic (ROC) analysis (figure 1) indicates the diagnostic accuracy of PSAD in identifying prostate cancer. The Area Under the Curve (AUC) for the PSAD was 0.9 (95% CI: 0.83–0.97), indicating strong diagnostic performance for predicting prostate cancer. The optimal cutoff point of 0.052 yielded a sensitivity of 85.0 % and a false positive rate (1-specificity) of 8.0%. PSAD metric had p-values <0.001, confirming its statistical significance and potential clinical application in detecting prostate cancer.
Discussion
Prostate cancer (CaP) is still of one of the most common cancers in men that is associated with preventable mortality.1,2 Thus, prostate specific antigen density, a diagnostic tool that has been shown to play a pivotal role in diagnosis and prediction of prostate.2,33-47 Recognition of suggestive symptoms, digital rectal examination, prostate specific antigen, transrectal ultrasonography and transrectal ultrasound scan guided prostate biopsy are complementary diagnostic parameters along with prostate specific antigen density for detection of prostate cancer.3,6,18,24,25,45
In the index study, the mean and median ages for all the participants with prostate cancer was 65.1 years and 64.0 years. These findings agree partially with mean ages of 69.5 years, 52.9 years, 68.2 years and 71.3 years as well as a median age of 66 years reported by Aisuodionoe-Shadrach in Abuja, Nigeria, Abonyo, et al in Kenya, Ngwu, et al in Uturu, South-Eastern Nigeria, Jeon, et al in South Korea and Yusim, et al in Israel respectively.2,18,25,33,41 Our study showed that 98.0 % of participants with prostate cancer were aged 50 years and above. Thus, it is obvious that prostate cancer is more likely to develop in older men, and the risk of developing prostate cancer increases gradually from the age of 40 years.18,24,48 This assertion suggests that age still remains the strongest risk factor for prostate cancer irrespective of the geographical location.6,18,24
In the index study, frequency of prostate cancer was 26.2% with all cases being adenocarcinoma. This frequency is lower than 34.0%, 42.9%, 53.2%, 54.9%, 59.6%, 65.0% and 67.2% reported by Jeon, et al in South Korea, Yusim, et al in Isreal, Sebastianelli, et al in Italy, Aisuodionoe-Shadrach, et al in Abuja, North-Central Nigeria, Abonyo et al in Kenya, Ogbetere in Auchi, Nigeria and Yanai, et al in Japan respectively.2,6,18,33,41,44,47 On the other hand, Ikuerowo, et al in Lagos, South-West Nigeria recorded a much lower rate of 12.6 % for prostate cancer.5 Most patients (95.0%) had clinically significant prostate cancer, ISUP/WHO grade group = 2 (Gleason score = 7) which is further confirmed by the results of our study wherein the majority of patients presented with advanced prostate adenocarcinoma featuring high grade tumour indicated by ISUP/WHO grade group 5 and summated Gleason score of 9 (47.0%), ISUP/WHO grade group 4 and summated Gleason score of 8 (17.0 %) and ISUP/WHO grade group 5 and summated Gleason score of 10 (7.0%) at the time of diagnosis. The finding of Danacioglu, et al in Turkey, Ikuerowo, et al and Ngwu, et al in Nigeria partly agrees with the index study with prostate adenocarcinoma ISUP/WHO grade group 5 being the most common tumour grade.5,25,39 This is however different from a result of much lower rate of 50% for clinically significant prostate adenocarcinoma reported by Yusim, et al in Israel.33 From the foregoing, it could be indicated that the clinically significant prostate adenocarcinoma with high tumour grade are far more common than the clinically insignificant prostate adenocarcinoma.
The mean and median values of prostate-specific antigen (PSA) for participants with prostate cancer were 43.2 ng/mL and 36.0 ng/ml respectively. The majority of the participants had serum PSA levels > 4 ng/mL (88.0%) and values ranging from 31-40 ng/ml (22.0%). These findings differs from mean of 45.2 ng/ml and 94.9ng/ml reported by Abonyo et al in Kenya and Ogbetere, et al in Auchi, Nigeria respectively but higher than value of 5.6ng/ml reported by Aminsharifi, et al in USA.2,6,42 On the other hand, median value of 18ng/ml recorded by Abonyo et al is much lower than what was obtained in our study.2 According to Ikuerowo et al in Nigeria demonstrated that 95% of participants diagnosed of prostate cancer had serum total PSA level of above10ng/L.5 Although an increasing serum prostate - specific antigen level above 4.0ng/ml may serve as a predictor of prostate cancer most times; this is however often challenged by the potential risk of false positivity or negativity associated with resultant over-diagnosis, under-diagnosis, and overtreatment of prostatic cancer. In addition, it has been shown that rising PSA is not strictly restricted to prostate cancer as conditions such as urinary tract infections, benign prostate enlargement, acute and chronic urinary retention, traumatic prostate biopsy, and vigorous digital examination.6,18,24 Thus, it is often suggested that patients with raised serum PSA level should be also have complementary ancillary diagnostic investigations such as prostate specific antigen density, transrectal ultrasonography and transrectal ultrasound scan guided prostate biopsy in order to rule out mimicking benign prostate lesions.3,6,18,24,25,45
In the index study, the mean and median values of prostate-specific antigen density (PSAD) were 0.31 + 0.23 ng/mL/cm3 and 0.31 ng/mL/cm3 respectively with the majority (27.0%) of the participants with prostate cancer having serum PSAD levels of 0.01-0.10 ng/mL/cm3. In contrast to our study, Nath, et al in Meghalaya recorded a much lower mean value of 0.15 ± 0.01 for PSAD while Ogbetere, et al reported a relatively high mean value of 0.42ng/mL/cm3.6,32 Furthermore, median PSAD values of 0.10 ng/ml/cm3 and 0.15 ng/ml/cm3 were recorded by Yusim, et al in Israel and Aminsharifi, et al in USA respectively;33,42 these findings are however 50 - 60% less than what was obtained in our study, even though majority of our participants had serum PSAD levels of 0.01-0.10 ng/mL/cm3 (27.0 %) that conforms to the finding of 35.1 % of the participants in a study by Abonyo et al reporting PSAD level of <0.15 ng/mL/cm3.2 The difference in findings may be partially explained by the different methods used at many centers in analysis of variables for PSAD such as PSA and prostatic volume.
The PSAD shows weak negative correlations with Gleason grading Score (r = -0.071) and ISUP/WHO grade group (r = -0.12), indicating minimal association with prostate cancer severity, and these relationships are not statistically significant. Participants with prostate cancer exhibited significantly higher PSAD (0.31±0.23 vs. 0.05±0.06) compared to participants with benign (non-cancer) prostatic disease (p-values <0.001). The ANOVA analysis shows a significant association between the PSAD and Gleason grading scores of prostate adenocarcinomas (F-value: 6.83, p<0.001) with the mean PSAD value being highest for summated Gleason score of 10 (0.5 ± 0.18) and lowest for score of 8 (0.13 ± 0.15). This result indicates that the PSAD varies significantly with prostate cancer severity and may help to distinguish various Gleason scores. The ANOVA analysis reveals a significant association between the PSAD and ISUP/WHO grade group of prostate adenocarcinoma (F-value: 5.33, p=0.001) with the prostate adenocarcinoma ISUP/WHO Grade Group 3 exhibiting the highest mean of 0.47±0.18. This finding suggests that PSAD varies significantly with cancer grade, with distinct differences between certain grade groups; this agrees with finding of Sebastianelli, et al, in their study.47
In the index study, univariate logistic regression showed positive association of age and PSAD with prostate cancer (p=0.002 & p=0.004 respectively) whereas a multivariate analysis showed that PSAD was not statistically associated with prostate cancer (p =0.024) compared to age which show a trend towards significant association with prostate cancer (p = 0.09). These findings suggested that a complex interplay of variables such as age and PSAD in predicting prostate cancer risk. These findings agree with the results of positive correlation between PSAD and prostate cancer reported by Sebastianelli, et al in Italy, Avci, et al in Turkey and Joan,et al in South Korea.37,41,47 In the index study, the Area Under the Curve (AUC) for the PSAD was 0.9 (95% CI: 0.83–0.97, p<0.001), indicating strong diagnostic performance for predicting prostate cancer. According to studies conducted by Yanai, et al in Japan, Park, et al in North Korea, Agbo et al in Nigeria, Morote, et al in Spain,Sinan, et al in Turkey, and Zou, et al in China, area under curve of PSA density was 0.698, 0.764, 0.84, 0.764 and 0.770 and 0.900 respectively (p <0.001) for predicting prostate cancer.1,33,37,38,43,44,45 These findings compare relatively with our study and those of Yusim, et al in Israel, with the area under curve being 0.64 (p=<0.001) for prediction of clinically significant prostate cancer.33 Furthermore, importance of PSAD in predicting prostate cancer was elucidated by a study by Presti, et al in USA.40
Our study recorded a PSAD cutoff point of 0.052 ng/ml/cm3 with a sensitivity of 85.0 % and a false positive rate of 8.0 %. This result relatively conforms with a finding of PSAD cutoff point of less than 0.08 ng/ml/cm3 with a 96% negative predictive value for prostate cancer in a study by Aminsharifi, et al in USA.42 On the other hand, Avci, et al in Turkey and Yanai, et al in Japan recorded the best cut-off values of PSAD of 0.11 and 0.20 ng/ml/cm3 respectively.37,44 Agbo, et al in North Central region of Nigeria, demonstrated a PSAD cut-off point of 0.12 ng/ml/cm3 with a sensitivity and specificity of 95.0% and 62.0% respectively.1 Abonyo, et al in Kenya reported PSAD of 0.23 with a sensitivity and specificity of 82.9% and 22.2%.2 A study by Jeon, et al,in South Korea indicated that a PSA density of 0.15 ng/mL/cm3 as the significant cutoff value for predicting positive target biopsy in groups with negative systematic biopsy.41 The variability in PSAD cut-off point, sensitivity and negative positive values reported in the different studies could probably be adduced to the fact that varied PSA kits produced by different companies might have been used, number of batches of PSA samples run during the study, as well as efficiency and accuracy of determining prostatic volume using varying methods and expertise.
From the foregoing, it is obvious that prostate specific antigen density improved the performance of prostate specific antigen to detect significant cancer (AUC 0.58 to 0.68) and any cancer (AUC 0.55 to 0.69, each p <0.001).42 In addition, PSAD has played a role in predicting clinically insignificant prostate cancer, and guide informed decision on conduction of prostate biopsy and prevent unwarranted prostate biopsy.33,43 Although a higher cut-off point in relation to a higher specificity with a tendency to reduction in false positive results has been suggested to reduce unnecessary prostate biopsy; this is however posed with the resultant low sensitivity that might create the more problematic issue of missing out patients with cancer.1 Thus, it is pertinent to balance the variables of prostate detection rate, specificity and negative positive values to avoid compromise either way.
Conclusion
A relatively lower PSAD level relative to other comparable studies was obtained as the cut-off value to predict prostate cancer when evaluating patients with raised or normal PSA in our population. PSAD showed statistical significance in cancer detection with improved detection rate, sensitivity and false positive rates.
Recommendation
A PSA density of 0.052 ng/ml/cm3 should be adopted as the cut-off value for predicting prostate cancer in our population.
Limitations of the study
The limitations of this study includes data specific to one population from one area located in South - South Nigeria. Therefore, results may not be extrapolated completely to other populations. Secondly, it should be highlighted that only PSAD was used as a predictive variable for prostate cancer.
Funding
The study was fully sponsored by the Tertiary Education Trust Fund for an institution-based study.
Conflicts of interest
All authors have no conflict of interest to declare.
References
- Agbo CA, et al. Usefulness of Prostate Specific Antigen Density in Prostate Cancer Detection among Men with PSA of 4-10 ng/ml. Ann Med Health Sci Res. 2020;10: 1138-1141.
- Abonyo C., Ndaguatha P, Owillah FA. To assess the correlation between prostate specific antigen density and prostate biopsy results of patients with raised prostatic specific antigen levels at the Kenyatta National Hospital. East African Medical Journal.2020; 97(8):2975-2982.
- Munteanu VC, Munteanu RA, Gulei D, Schitcu VH, Petrut B, Berindan Neagoe I, Achimas Cadariu P, Coman I. PSA Based Biomarkers, Imagistic Techniques and Combined Tests for a Better Diagnostic of Localized Prostate Cancer. Diagnostics (Basel).2020;10:806.
- Okuja M, Ameda F, Dabanja H, Bongomin F, Bugeza S. Relationship between serum prostate specific antigen and transrectal prostate sonographic findings in asymptomatic Ugandan males. African Journal of Urology.2021;27:e58.
- Ikuerowo SO, Omisanjo OA, Bioku MJ, Ajala MO, Mordi VP, Esho JO. Prevalence and characteristics of prostate cancer among participants of a community-based screening in Nigeria using serum prostate specific antigen and digital rectal examination. Pan Afr Med.J.2013; 15:129.
- Ogbetere FE, Irekpita E. Detection rate of prostate cancer following 12-core extended biopsy in a Semi-urban Nigerian Tertiary Hospital. Urology Annals.2021;13:150-155.
- Soronen V, Talala K, Raitanen J, Taari K, Tammela T, Auvinen A. Digital rectal examination in prostate cancer screening at PSA level 3.0-3.9 ng/ml: long-term results from a randomized trial. Scand J Urol. 2021;55(5):348-353.
- Beyer K, Moris L, Lardas M, Haire A, Barletta F, Scuderi S, et al. Diagnostic and prognostic factors in patients with prostate cancer: a systematic review protocol. BMJ Open. 2021;11:e040531.
- Mensah JE, Akpakli E, Kyei M, Klufio K, Asiedu I, Asante K, et al. Prostate-specific antigen, digital rectal examination, and prostate cancer detection: A study based on more than 7000 transrectal ultrasound-guided prostate biopsies in Ghana. Translational Oncology;2024; 51:102163.
- Ying Y, He W, Xiong Q, Wang Z, Wang M, Chen Q, et al. Value of digital rectal examination in patients with suspected prostate cancer: a prospective cohort analysis study. Transl Androl Urol. 2023;12(11):1666-1672.
- Zhu J, Wu X, Xue Y, Li X, Zheng Q, Xue X, et al. Prospective analysis of the diagnostic accuracy of digital rectal examination and magnetic resonance imaging for T staging of prostate cancer. J Cancer Res Ther. 2023;19(4):1024-1030.
- Sarkar D, Jain P, Gupta P, Pal DK. Correlation of digital rectal examination and serum prostate-specific antigen levels for detection of prostate cancer: Retrospective analysis results from a tertiary care urology center. J Cancer Res Ther. 2022;18(6):1646-1650.
- Elijah A. Udoh, Okon E. Akaiso, Albert E. Ukpong.Accuracy of digital rectal examination to diagnose prostate cancer confirmed by needle biopsy reports: A3–year hospital-based study.Ibom Medical Journal.2020;13(3):156-163.
- Bouras, S. Digital rectal examination in prostate cancer screening: a critical review of the ERSPC Rotterdam study. Afr J Urol. 2023;30, 51:1-6.
- Morote J, Paesano N, Picola N, Muńoz-Rodriguez J, Ruiz-Plazas X, Muńoz-Rivero MV, et al. The Role of Digital Rectal Examination for Early Detection of Significant Prostate Cancer in the Era of Magnetic Resonance Imaging. Life. 2024; 14(11):1359.
- Matsukawa A, Yanagisawa T, Bekku K, Parizi MK, Laukhtina E, Klemm J, et al. Comparing the performance of digital rectal examination and prostate-specific antigen as a screening test for prostate cancer: a systematic review and meta-analysis. European Urology Oncology. 2024; 7 (4):697-704.
- Krilaviciute A, Becker N, Lakes J, Radtke JP, Kuczyk M, Peters I, et al.. Digital Rectal Examination Is Not a Useful Screening Test for Prostate Cancer. European Urology Oncology,2023; 6(6):566-573.
- Aisuodionoe-Shadrach OI, Eniola SB, Nwegbu MM, Kolade-Yunusa HO, Okereke OO, Yunusa T. Determination of Serum Prostate Specific Antigen Levels Amongst Apparently Healthy Nigerian Males in a University and University Hospital Community in the Federal Capital Territory. Cancer Control.2022; 29:10732748221081366.
- Mumuni S, O'Donnell C, Doody O. The Risk Factors and Screening Uptake for Prostate Cancer: A Scoping Review. Healthcare (Basel). 2023;11(20):2780.
- Cirulli GO, Davis M, Stephens A, Chiarelli G, Finati M, Corsi N, et al. Impact of Prostate-Specific Antigen Screening Pattern on Prostate Cancer Mortality Among Non-Hispanic Black and Non-Hispanic White Men: A Large, Urban Health System Cohort Analysis. J Urol. 2024;212(4):560-570.
- Hamdy FC. Prostate-Specific Antigen Testing for Prostate Cancer Screening-Is the Message Getting Through? JAMA Oncol. 2022; 8(1):47-49.
- Narain TA, Sooriakumaran P. Beyond Prostate Specific Antigen: New Prostate Cancer Screening Options. World J Mens Health. 2022;40(1):66-73.
- Ko, YH, Kim BH, Jung W, Ha JY, Shin TJ, Kwon SY, et al. Delaying a Biopsy With Serial Prostate-Specific Antigen Checkup Helps to Identify a Significant Prostate Cancer: A Strategy to Evade Unnecessary Procedures.J Urol Oncol. 2022;20(3):177-185.
- TiddJohnson A, Sebastian SA, Co ELF, Afaq M, Kochhar H, Sheikh M, et al. Prostate cancer screening: continued controversies and novel biomarker advancements. Curr Urol. 2022;1–10.
- Ngwu PE, Achor GO, Eziefule VU, Orji JI, Alozie FT. Correlation between Prostate Specific Antigen and Prostate Biopsy Gleason Score. Annals of HealthResearch.2019;5:243-248.
- Chang TH, Lin WR, Tsai WK, Chiang PK, Chen M, Tseng JS,et al. Zonal adjusted PSA density improves prostate cancer detection rates compared with PSA in Taiwanese males was with PSA < 20 ng/ml. BMC Urol.2020;20(1):151.
- Park DH, Yu JH. Prostate-specific antigen density as the best predictor of low- to intermediate-risk prostate cancer: a cohort study. Transl Cancer Res 2023;12(3):502-514.
- Erdogan A, Polat S, Keskin E, Turan A. Is prostate volume better than PSA density and free/total PSA ratio in predicting prostate cancer in patients with PSA 2.5-10 ng/mL and 10.1-30 ng/mL? Aging Male. 2020;23(1):59-65.
- Zou BZ, Wen H, Luo HJ, Luo WC, Xie QT, Zhou MT. Value of serum free prostate-specific antigen density in the diagnosis of prostate cancer. Ir J Med Sci. 2023;192(6):2681-2687.
- Zhang Q, Li H, Song Z, Kong S, Zhao S, Fan S, Qin F, Ma J. Potential diagnostic value of multiple indicators combined with total prostate-specific antigen in prostate cancer. J Int Med Res. 2023;51(10):3000605231204429.
- Omri N, Kamil M, Alexander K, Alexander K, Edmond S, Ariel Z, et al. Association between PSA density and pathologically significant prostate cancer: The impact of prostate volume. Prostate. 2020;80(16):1444-1449.
- Nath C, Barman B, Phukan P, Sailo SL, Dey B, Nath I, et al, Prostate-Specific Antigen Density: A Measurement to Differentiate Benign Hypertrophy of Prostate from Prostate Carcinoma. Journal of Laboratory Physicians. 2020;12(1):44-48.
- Yusim I, Krenawi M, Mazor E, Novack V, Mabjeesh NJ. The use of prostate specific antigen density to predict clinically significant prostate cancer. Sci Rep.2020;10(1):20015.
- Arafa MA, Farhat KH, Rabah DM, Khan FK, Mokhtar A, Al-Taweel W. Prostate-specific Antigen Density as a Proxy for Predicting Prostate Cancer Severity: Is There Any Difference between Systematic and Targeted Biopsy? Saudi J Med Med Sci.2023;11(4):299-304.
- Drevik J, Dalimov Z, Uzzo R, Danella J, Guzzo T, Belkoff L, et al. Utility of PSA density in patients with PI-RADS 3 lesions across a large multi-institutional collaborative. Urol Oncol. 2022;40(11):490.e1-490.e6.
- Rajendran I, Lee KL, Liness Thavaraja L, Barrett T. Risk stratification of prostate cancer with MRI and prostate-specific antigen density-based tool for personalized decision making, British Journal of Radiology. 2024; 97(1153):113–119.
- Avci S,Çaglayan V,Önen E, Kiliç M,Gül A, Öner S. The effectiveness of prostate specific antigen density in predicting prostate cancer and clinically significant prostate cancer in patients aged 70 years and over.Turkish Journal of Geriatrics.2020;23(2):197-205.
- Zou, BZ., Wen, H., Luo, HJ. et al. Value of serum free prostate-specific antigen density in the diagnosis of prostate cancer. Ir J Med Sci. 2023;192:2681–2687.
- Danacioglu, YO, Keser, F, Efiloglu, Ö, Culpan, M., Polat, S., Atis, R. G., & Yildirim, A. The efficiency of prostate-specific antigen density measurement using three different methods on the prediction of biochemical recurrence. The Aging Male.2021;24(1):15–23.
- Presti JCJr, Hovey R, Carroll PR, Shinohara K. Prospective Evaluation of Prostate Specific Antigen and Prostate Specific Antigen Density in the Detection of Non palpable and Stage T1C Carcinoma of the Prostate. Journal of Urology [Internet]. 2024;156(5):1685–90.
- Jeon JH, Koo KC, Chung BH, Lee KS. Usefulness of Prostate-Specific Antigen Density as an Indicator for Recommending Prebiopsy Magnetic Resonance Imaging to Prevent Missed Prostate Cancer Diagnoses. J Urol Oncol. 2021;19(3):155-163
- Aminsharifi A, Howard L,Wu Y, Hoedt AD, Bailey C, FreedlSJ, et al. Prostate Cancer When the Prostate Specific Antigen is in the Diagnostic Gray Zone: Defining the Optimum Cutoff Point Stratified by Race and Body Mass Index.The journal of urology.2018;200:758-766.
- Morote, J., Borque-Fernando, A.; Triquell, M.; Celma, A., Regis, L., Mast, R.; de Torres, I.M., et al. Comparative Analysis of PSA Density and an MRI-Based Predictive Model to Improve the Selection of Candidates for Prostate Biopsy. Cancers. 2022; 14:2374.
- Yanai Y, Kosaka T, Hongo H, Matsumoto K, Shinojima T, Kikuchi E, et al. Evaluation of prostate-specific antigen density in the diagnosis of prostate cancer combined with magnetic resonance imaging before biopsy in men aged 70 years and older with elevated PSA. Mol Clin Oncol. 2018; 9(6):656-660.
- Park DH, Yu JH. Prostate-specific antigen density as the best predictor of low- to intermediate-risk prostate cancer: a cohort study. Transl Cancer Res. 2023;12(3):502-514.
- Zor M, Kaya E, Bedir S. Contribution of prostate-specific antigen density in the prediction of prostate cancer: Does prostate volume matter?. Gulhane Med J. 2018;60(1):14-18.
- Sebastianelli A, Morselli S, Vitelli FD, Gabellini L, Tasso G, Venturini S, et al. The role of prostate-specific antigen density in men with low-risk prostate cancer suitable for active surveillance: results of a prospective observational study. Prostate Int. 2019;7(4):139-142.
- Zhang K, Bangma CH, Roobol MJ. Prostate cancer screening in Europe and Asia. Asian J Urol. 2017;4:86-95.
- Abudu EK, Fabian UA, Udoh EA, Ukpong AE, Kudamnya IJ, Akaiso OE, et al. Knowledge of symptoms, signs and risk factors of prostate cancer among male senior staff of university of Uyo and teaching hospital. World J Biomed Res. 2021;8:8-16.
- Araoye M. subject selection. In: research methodology with statistics for health and social sciences,. 1st ed. Ilorin: nathadex publishers; 2004:115–9.