Comparative sonographic assessment of the spleen in individuals with and without sickle cell anaemia in Abakaliki, Nigeria
Alaneme L N1, Ugwu N I2, Orji M O1, Akhigbe A O3, Ugwuegbu J U4, Isiozor I4
Abstract
Background: Sickle cell anaemia (HbSS) is a major public health problem in Sub-Saharan Africa and commonly affects the spleen, with associated increased morbidity and mortality. This study aimed to evaluate the ultrasonographic findings of the spleen in patients with HbSS in steady state and to compare findings with those of individuals with normal adult haemoglobin (HbAA).
Methods: This was a cross-sectional comparative study. Haemoglobin phenotypes were determined using haemoglobin electrophoresis. The spleen was scanned using transabdominal ultrasonography. Splenic size and parenchymal echotexture were assessed. Data was analysed with SPSS software, version 20.
Results: One-hundred-and-twenty participants were recruited for the study, made up of 60 patients with HbSS and 60 age-and-sex-matched individuals with HbAA. They were made up of 54 (45%) males and 66 (55%) females, aged 2 to 32years, with mean age of 15.78 ±7.2 years for HbSS and 15.80 ±7.5years for HbAA participants. Thirteen (21.7%) patients with HbSS had autosplenectomy, 7 (11.7%) had splenomegaly, 6 (10%) had shrunken spleens, while 34 (56.7%) had normal sized spleens. All the participants with HbAA had normal splenic size with age. Of the 47 patients with HbSS whose spleen were visualized, 20 (42.6%) had abnormal splenic echotexture, whereas all the 60 (100%) participants with HbAA, had normal echotexture. There was significant difference in splenic echotexture in patients with HbSS compared to those with HbAA (p <0.05).
Conclusion: A number of patients with HbSS have abnormal splenic size and echotexture compared to those with HbAA. There should be adequate follow up of patients with HbSS to prevent possible resultant splenic complications.
Keywords: Haemoglobin, Sickle cell anaemia, Sonographic assessment, Spleen
Introduction
The spleen, which is the largest lymphoid organ in the body plays an important role in the body’s immune response, quality control for senescent or altered erythrocytes.1,2 Sickle cell anaemia (SCA, HbSS) is one of the wide range of pathologic disorders that commonly affects the spleen.3
Sickle cell anaemia is a hereditary disorder of haemoglobin caused by point mutation of the haemoglobin gene with resultant substitution of valine for glutamic acid at the 6th position of the beta globin chain with resultant abnormal haemoglobin (HbS). This leads to abnormally sickle-shaped and rigid red blood cells under hypoxic condition, with resultant hemolysis and vaso-occlusive episodes.4 Sickle cell anaemia constitutes a major public health problem in Nigeria, a country with the top sickle cell endemic country in Africa as well as the country with the highest burden of sickle cell anaemia in the world.5,6 Homozygous inheritance of Haempglobin S is known as sickle cell anaemia and heterozygous inheritance of Haemoglobin S with other abnormal haemoglobin, all constitute sickle cell disease.6
One of the most frequently affected organ in sickle cell anaemia is the spleen.7,8 This is as a result of the intrinsically tortuous and sluggish microcirculation in the spleen which enhances prolonged vascular transit time, hence favouring red blood cell sickling with repeated vascular occlusions and multiple splenic infarctions.4,7,9 The spleen is morphologically normal at birth in sickle cell anaemia, but as patient’s age advances, it experiences a sequence of parenchymal and dimensional alterations, as a result of repeated and progressive injury.2,7 The spleen usually enlarges during infancy and childhood, then shrinks gradually as the patient increases in age, due to repeated episodes of vaso-occlusion and infarction.7,10 This eventually leads to autosplenectomy which usually occurs between the ages of 8 and 10 years.10 However, this is not always the case, as splenomegaly, in some cases, can persist into adulthood.7,10 and is commonly seen in patients with SCA in Africa. Several studies,4,6 have reported racial, regional and ethnic variation in splenic changes in patients with SCA. When compared with sickle cell anaemic patients with autosplenectomy, the presence of persistent splenomegaly in adult may indicate a different severity of disease as patients with autosplenectomy are more likely to show evidence of greater immune dysfunction due to absence of the spleen.11 Occasionally, patients with persistent splenomegaly may develop signs of hypersplenism, acute splenic sequestration and splenic abscess, which are associated with morbidity and mortality.7,10 As a result, continuous splenic monitoring and early detection of splenic pathologies using ultrasonography will enable caregivers of HbSS patients to adopt appropriate treatment and preventive measures.
Interestingly, sonographic findings of the spleen in HbSS are so characteristic and knowledge of the ultrasonographic findings of the spleen in HbSS is essential as the radiologist may be the first to draw attention of the craegivers to a case of HbSS in an unscreened individual when abdominal ultrasonography for other diseases are being carried out.12 Ultrasonography is a more reliable and accurate method for measuring the actual splenic size as well as assessing the splenic appearances.13,14 Ultrasonography is a simple, affordable, non-invasive, non-ionizing, repeatable, easily accessible and readily available technique of imaging the spleen.
The aim of this study was to compare the various spectra of ultrasonographic findings of the spleen in patients with HbSS in steady state with that of age- and sex- matched individuals with haemoglobin AA.
Materials and methods
Study design and study site
This was a cross–sectional comparative study conducted from May to October 2020 at Alex Ekwueme Federal University Teaching Hospital, Abakaliki, (AEFUTHA) Ebonyi state, South East Nigeria.
Study population
Study population was made up of patients with HbSS in steady state who attended Sickle Cell Clinic of AEFUTHA during the study period and a control group of age- and sex-matched individuals with HbAA recruited from among staff, medical students, patients’ relatives and children that came for immunization.
Inclusion and exclusion criteria
Inclusion criteria for study group were: known HbSS patients, aged 0 to 60 years, and in steady state.4
Steady state was described as a time when there had been no recent episodes of acute illness, or discomfort for at least 4 weeks and no blood transfusions in three months prior to recruitment.4
Exclusion criteria for the study group included: known HbSS patients who had undergone surgical splenectomy, patients in crisis or with any form of acute illness, patients over the age of 60years, patients with any chronic illness not related to sickle cell anaemia (example: patients with any congenital malformation, diabetes mellitus, and chronic liver disease), patients on Hydroxyurea therapy, patients who had bone marrow transplantation and patients who are pregnant.
The inclusion criteria for the control group were subjects with hemoglobin AA within the age range of 0 and 60 years. The exclusion criteria for HbAA participants were those with any chronic illness or systemic disease, those who have had surgical splenectomy, or pregnant.
Sample Size
This was calculated using the formula for cross sectional study (Cochran’s formula )15, and a HbSS prevalence rate of 3.5% from a previous study.16 A sample size of 52 was calculated using the formula: N = Z2 P(1-P)
D2
Where, N is the required sample size, Z is the standardized normal deviation usually set at 1.96, which corresponds to 95% confidence level, P is the prevalence rate of the condition and D is the desired level of precision set at 0.05. However, 60 participants were enrolled for each group, making a total of 120 participants.
Sampling Technique
Participants were selected using the simple random sampling technique.
Ethical issues
Ethical clearance for this study was obtained from the Health Research and Ethics Committee of Alex Ekwueme Federal University Teaching Hospital Abakaliki (Registration number FETHA/REC/VOL 2/2019/274), prior to the commencement of the study. Informed written consent was obtained from participants who were 18 years and above while child assent was obtained from participants who were below 18years but not less than 7 years, once parental consent was obtained.
Data collection
Pre-tested, semi-structured, interviewer-administered, questionnaires were used to collect data on socio-demographic characteristics, drug history, previous medical and surgical history.
Standiometer was used to measure participants’ height to the nearest centimeter, while weighing scale was used to measure their weights to the closest kilogram. Body mass index (BMI) was computed as follows: BMI = Weight (kg)/ Height2 (m2).
The haemoglobin genotype of controls was determined by haemoglobin electrophoresis using electrophoretic tank (Gallenkomp, England).with cellulose acetate paper at pH 8.6. The test group were HbSS patients already diagnosed of SCA and were registered at the sickle cell center of the hospital.
Abdominal scan of the participants were done using Sonoscape model S40R (Sonoscape Medical Corp, China), ultrasound scanner, equipped with a 2-5 MegaHertz multifrequency curved array transducer. No preparation or sedation was used.
The splenic echopattern, as well as any lesions identified within it, were documented. The coronal plane section was utilized to rule out any splenic lesions. All measurements were made on sections through the splenic hilum in order to create a constant reference point for repeating measurements.14 The transverse, longitudinal and antero-posterior dimensions of the spleen were measured. Longitudinal dimension was measured between the most superomedial and the most inferior poles of the spleen on longitudinal section (figure 1). The transverse dimension was measured between the most medial and lateral aspects of the spleen at the level of the hilum on longitudinal section (in a plane perpendicular to the longitudinal dimension) as shown in figure 1. The anteroposterior dimension was measured at the maximum anteroposterior distance on transverse section at the level of the hilum as illustrated in figure 2. Measurements were made during quiet breathing in children, while in adults it was done on holding their breath. Three sequential measurements were obtained in the nearest centimeter and the mean calculated. This is to ensure minimum intra-operator variation as well as greater reliability and accuracy of measurements. All dimensional measurements were expressed in centimeters.
Splenomegaly was documented when the long axis of the organ is greater than 13cm in adults.17,18 While in paediatric age group, splenomegaly was documented when the long axis of the spleen is greater than the normal splenic size for age and sex as described by Megremis.19 Mild splenomegaly is when the longitudinal measurement exceeds the upper limit of normal by less than 10%, moderate splenomegaly is when the measurement is 10-20% greater than normal and marked splenomegaly is when the measurement is more than 20% greater than upper limit of normal.18 Non visualization of the spleen was documented as autosplenectomy.18 Shrunken spleen is when the long axis of the spleen measures less than 5cm in adults20,21 and less than 50% of the mean splenic size for age in children.7
Splenic index (SI) was obtained by the following formula: SI (cm2) = L (cm) x W (cm). Where L =longitudinal dimension and W = transverse dimension.22
Splenic volume was calculated using the formula: Spleen volume (cm3) = L (cm) x W (cm) x D (cm) x 0.523. Where, L = longitudinal dimension, W = transverse dimension, D = anterior-posterior dimension.
The parenchymal echopattern of the spleen was evaluated ultrasonographically and compared with the echopattern of the liver and that of the cortex of the adjacent left kidney. The normal parenchyma of the spleen has homogeneous echopattern with reflectivity that is similar or slightly brighter than the normal liver and slightly brighter than the normal adjacent left kidney.23
Splenic echopattern was recorded as any of the following: normal homogenous parenchyma, diffuse homogenously hyperechoic parenchyma, diffuse homogenously hypoechoic parenchyma, heterogeneously hyperechoic parenchyma, heterogeneously hypoechoic parenchyma, echogenic shadowing foci (calcification littered) parenchyma or presence of hypoechic nodules.24
Data analysis
This was done using the International Business Machine Statistical Package for Social Sciences (IBM-SPSS) for windows, version 20.0. Normality of distribution of data was done using Shapiro-Wilk test. Normally distributed data: age, longitudinal and anteroposterior dimensions of the spleen were analyzed using parametric statistics (t-test) while the non-normally distributed data: the transverse dimension of spleen, splenic index and splenic volume were analyzed using non-parametric statistics (Mann-Whitney U-test). Comparison of the splenic size between the HbSS and HbAA participants was done using an independent t-test (for longitudinal and anteroposterior dimensions), and a Mann-Whitney U-test (for the transverse dimension, splenic index and splenic volume). The results were summarized as mean and standard deviation for normally distributed data and median and interquartile range for non-normally distributed data. However, categorical variables were summarized using frequencies and percentages. All test were two-tailed at 95% interval; p-values less than 0.05 was considered statistically significant. Results were presented in tables and figures.
Results
![]()
Figure 1: Transabdominal ultrasonogram showing the longitudinal dimension and transverse dimension of the spleen in longitudinal scan (transverse dimension measured in a plane perpendicular to the longitudinal dimension)
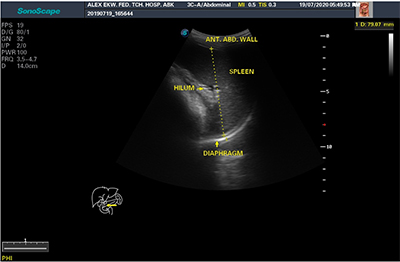
Figure 2: Transabdominal ultrasonogram showing anteroposterior dimension of the spleen in transverse scan (ANT. ABD. WALL = Anterior Abdominal Wall)
Table 1: Socio-demographic characteristics of the study participant, N =120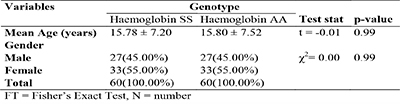
A total number of 120 participants were recruited into this study, with one half (60) being patients with HbSS, while the other half (60) were age-and sex-matched participants with HbAA. The age of the participants ranged from 2 – 32 years in both groups. The socio-demographic characteristics of the study population revealed that the two study groups (HbSS and HbAA participants) were similar in age (p = 0.99) and gender (p =0.90). Forty five percent (45%) of the participants in both groups were males, while 55% were females (table 1).
Table 2: Age and sex distribution with splenic size among patients with sickle cell anaemia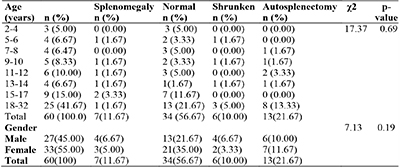
The sex and age distribution, and splenic size in patients with HbSS, showed that there was no significant differences in the distribution of the various categories of splenic size with gender and age (p =0.19 and 0.69, respectively). Autosplenectomy, however, was recorded in 13 patients (21.7%), with the highest frequency seen in patients aged 18 and above (13.3%) (table 2).
Table 3: Age distribution and splenic measurement in patients with sickle cell anaemia in steady state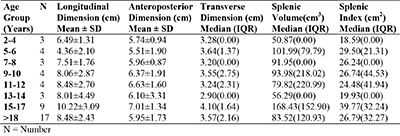
There were variations in splenic measurement in different age groups among patients with HbSS, whose spleens were visualized ultrasonographically. The mean longitudinal dimension, anteroposterior dimension, transverse dimension, splenic volume and splenic index were highest in patients aged 15-17 years. The splenic volume and splenic index were lowest in those aged 2-4 years (table 3).
Table 4: Age distribution of splenic echopattern in patients with sickle cell anaemia who have their spleen demonstrated ultrasonographically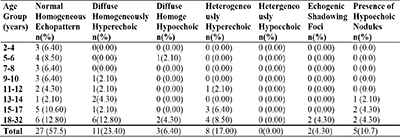
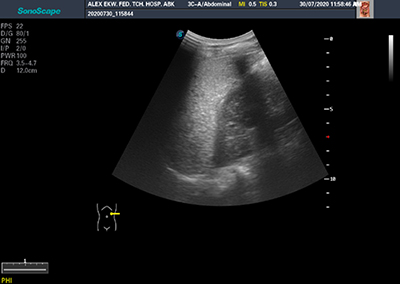
Figure 3A: Image showing diffuse homogenenously hyperechoic spleen in a patient with sickle cell anaemia (HbSS)
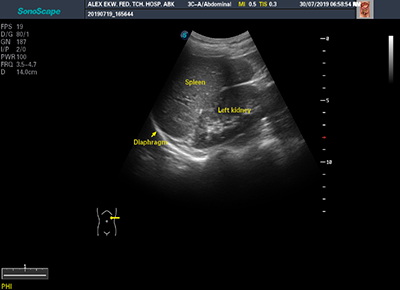
Figure 3B: Image showing normal splenic echopattern in HbAA individual
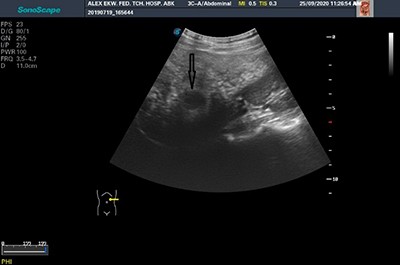
Figure 4: Image showing the presence of hypoechoic nodule in a patient with sickle cell anaemia (black arrow)
Majority (57.5%) of patients with HbSS had normal homogenous splenic echopattern. diffuse homogeneously hyperechoic splenic echopattern, was the most common abnormal splenic echopattern (23.4%) (Table 4) (figure 3 and figure 4).
Table 5: Comparison of splenic size between participants with sickle cell anaemia and those with haemoglobin AA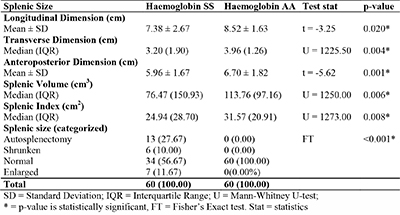
Mean values of all the dimensions (longitudinal, transverse, and anteroposterior dimensions) of the splenic size, splenic index and splenic volume were significantly smaller in patients with HbSS when compared with persons with HbAA (table 5).
Discussion
The age range of subjects that participated in this study was between 2 and 32 years. No HbSS patients below the age of 2 years presented to the sickle cell clinic during the period of this study. This may be due to delay in clinical manifestation of the disease seen in infancy, probably caused by the persistence of significant amount of foetal haemoglobin (HbF) seen in this age group, which inhibits polymerization of haemoglobin-S (HbS), resulting in delayed clinical presentation of the disease.25 As the child grows, the HbF declines with commensurate rise in HbS, which results in clinical manifestation of the disease.25 Another reason for delayed presentation may be parental lack of adequate knowledge of the disease and its manifestation as well as lack of routine newborn screening for sickle cell anaemia, for early detection of the disease in our environment.26
The highest age recorded in the index study was 32 years. This may be attributed to the considerable reduced average life expectancy in patients with HbSS in our environment due to organ damage, especially in those with severe disease.4,27 Another reason may be due to poor compliance to medical visits by adult patients. This may be attributed to financial impact of the disease on the patients, as most of them pay out of their pockets, and may prefer to present to the hospital only when they have severe symptoms, in order to reduce cost of care. The age range of patients with HbSS who participated in this index study, is similar to those of Luntsi et al21 and Ezeike et al28 in their studies, with age ranges 3-38years and 3-30years, respectively. Other studies done in different geographical locations included age groups at variance with that of the present study, in children and adults.29-34
Analysis of our results showed that splenomegaly was found in 11.7% of the participants with HbSS. This result is similar to the findings of Ojo et al, in Ile-Ife, Nigeria,34 who found splenomegaly in 15% of patients with HbSS. Result of this study is also in line with other studies done in Boston, United States by Gale et al24, in Northern Greece by Christakis et al35 and in Saudi Arabia by Al-Salem et al22, where the rates of splenomegaly found in patients with HbSS were 15.1%, 14% and 11.8% respectively. The rate of splenomegaly in this study is lower than the findings of Abdullahi et al31 in their study in Kano, who recorded splenomegaly of 53 (35%) in subjects with HbSS. This may be related to the fact that in their study, only splenic index was used in assessing the splenic size which does not take into consideration the normal splenic size in relation to age, such that the same normal limit was used in different age groups. Again, the rate of splenomegaly in the study under review is lower than the findings of Adekile et al10 in their study done in Ile-Ife, who found splenomegaly in 47 (33.8%) out of 139 patient with HbSS. The contrasting finding may be attributed to the differences in the study populations and methodology. Their study was done in children and palpation method was used in assessing the splenic size, which may not ascertain the true size of the spleen, as the spleen may be palpable in 10% of healthy children.19 Another study done in Calabar, Nigeria by Inah et al18 found lower frequency of splenomegaly in their study; they found splenomegaly in 1(0.83%) patient compared to 11.7% that was found in this study. This may be due to the variation in methodology and criteria used in defining splenomegaly. They used the same normal limit (greater than 13cm) to define splenomegaly for all the age groups (adults and children).
Among the patients with HbSS who had splenomegaly in this study, 2(28.6%) were within the group of 10years and below, 3(42.9%) were within the age group of 11-17years, while 2(28.6%) were aged 18 years and above. This shows that the rate of splenomegaly in patients with HbSS does not follow a particular trend. However, this is contrary to the study done by Abdullahi et al31 who recorded higher rate of splenomegaly in subjects less than 10 years. The contrasting observation may be due to the difference in the study population, as a greater number of their study population was less than 10 years of age.
Autosplenectomy was found in 13(21.7%) out of 60 patients with HbSS as ascertained by non-visualization of the spleen during ultrasonography, in the absence of surgical splenectomy. The rate of autosplenectomy in this study is similar to the studies done in Nigeria by Ojo et al34 at Ile-Ife, who documented a rate of 20%, Awotua-Efebo et al33 in Port Harcourt, who recorded a rate of 20% and Luntsi et al21 in Maiduguri, who found a rate of 17%. However, our finding is not in agreement with the observations of Inah et al18, Babadoko et al36 and Gale et al24, who reported higher rates of autosplenectomy at 32.5%, 55.4% and 39.5% respectively. Differences in ethnicity, and sampling may have contributed to these variations. Lower rates of autosplenectomy which are contrary to the findings of this index study were recorded in India by Kaushal et al30, and Saudi Arabia by Al-Salem et al22, who documented the rates of autosplenectomy at 11% and 6.6%, respectively. This may be attributed to differences in clime and haplotype, as well as co–inheritance of alpha thalassaemia and high fetal haemoglobin in subjects with HbSS from these regions22. Out of the 13 patients with autosplenectomy in this study, 2(15.4%) were aged 10years and below, while 11(84.6%) were above the age of 10years. This is similar to the findings of Inah and colleagues18 who found autosplenectomy to be much higher in individual greater than 10 years of age. In this study, all the patients with HbSS who had autosplenectomy were aged 8 years and above, which is in consonance with the generally believed natural progression of sickle cell anaemia. The higher rate of autosplenectomy seen in this age group has been attributed to the progressive reduction in size of the spleen in patients with HbSS, due to recurrent episodes of vaso-occlusion and infarction that happen over time, and finally, resulted to autosplenectomy.10,37
Shrunken spleen is another splenic ultrasonographic finding seen in patients with HbSS in this study. The presence of shrunken spleen in patients with HbSS has been attributed to the repetitive occlusion of the splenic vessels by the sickle red blood cells, followed by splenic ischaemia, which progressively leads to splenic atrophy.7 In this study, shrunken spleen was seen in 6(10%) of patients with HbSS. This is similar to the findings from a study done in Boston, United States by Gale et al24 which found shrunken spleen in 14% of patients. This may suggest that shrunken spleen is a common splenic ultrasonographic finding in patients with HbSS. However, Inah and colleagues18 found a lower rate of 2.5%. The lower rate of shrunken spleen found in the latter research may be due to variation in sampling method.
Various studies18,21,24,31 have reported normal splenic size in patients with HbSS. Similarly, the index study recorded normal splenic size in 56.7% (34/60). This finding was also recorded by Awotua-Efebo et al33 who observed normal splenic size in 53%, Abdullahi et al31 who found normal splenic size in 60% and Ojo et al34 who found normal splenic size in 65% of patients with HbSS. Asnani et al11 postulated that the presence of the spleen in patients with HbSS especially in adult patients may represent a different severity in the disease when compared with those who had autosplenectomy, as the latter was as a result of repeated attacks of vaso-occlusion and resulting infarction, while the presence of the spleen is due to fewer vaso-occlusive crises indicating milder disease. The rate of normal splenic size in patients with HbSS from this study is high compared to the value of 9.8% and 23.3% reported by Luntsi et al21 and Gale et al,24 respectively. The lower rate of normal splenic size found in their studies may be due to variations in the study design, ethnicity and possibly more severe disease.
Regarding splenic echopattern, out of the 60 HbSS who participated in this study, 78.3% (47/60) had their spleen visualized ultrasonographically. Of these 47 patients whose spleen were visualized, 11(23.4%) had diffuse homogeneously hyperechoic splenic echopattern. The rate of diffuse homogeneously hyperechoic echopattern found in this study was lower than the observations of Luntsi and colleagues21, who reported increased splenic echopattern in 83.3% of patients with HbSS. This may be attributed to their study population, environment and disease severity. In addition, Gale et al24 reported echogenic spleen in 80% of patients with HbSS which was higher than the rate that was recorded in this study. The variation in rate may be due to inclusion of patients with HbSS that were being treated with hydroxyurea in their own study, who were excluded in this present study. This is because patient with HbSS on hydroxyurea tend to have abnormal splenic echopattern, which may be a reflection of a more severe disease, that led to the initial prescription of hydroxyurea.24 This goes to show that diffuse homogenously hyperechoic splenic echopattern is a common finding in patients with HbSS, and more so in patients with more severe disease.
This study also found that 17% (8/60) participants with HbSS had heterogeneously hyperechoic splenic echopattern. This observation was corroborated by the findings of Luntsi et al,21 who reported coarse splenic echopattern in 14.5% of patients recruited into their study, indicating that heterogeneously hyperechoic splenic echopattern could be a finding in patients with HbSS. This goes to uphold the validity of statement made by Lagundoye,12 that “knowledge of the radiologic findings of the spleen in sickle cell anaemia are sufficiently characteristic that the radiologist may be the first to direct attention to the predominant or coincidental problem of the disease, when routine investigations for other diseases are being carried out”. The rate of heterogeneous hyperechoic splenic echopattern in this study was lower compared with the study by Gale et al24 who found heterogeneously appearing spleen in 57.8% of patients. The inclusion of patients on treatment with hydroxyurea in their study may also be responsible for the higher rate noted, indicating severe disease.
The index study showed that 4.3% (2/60) of participants with HbSS had foci of splenic echogenic shadowing. Similarly, Balci et al38 noted multiple echogenic foci in 1(1.27%) patient. On the other hand, Gale et al24, Kaushal et al30 and Luntsi et al21 found higher rates of splenic echogenic foci of 11.8%, 8% and 8.7% respectively, compared to the index study. The higher prevalence of splenic echogenic foci in the studies by Gale et al24 and Kaushal et al30 may be due to difference in geographical locations, as their studies were carried out in the United states and India, respectively. In addition, study conducted by Gale et al24 was a retrospective, three-year study, with inclusion of patients on treatment with hydroxyurea, which may also affect the splenic echopattern. Presence of hypoechoic nodules was seen in 5(10.6%) patients in this study, which is similar to the finding of Balci et al,38 who reported presence of hypoechoic nodules in 5(6%) patients, and Kaushal et al,30 who found hypoechoic nodules in 5%. Conversely, Gale et al24 reported hypoechoic nodules in 86.7%. Differences in geographical location and inclusion of patients on supportive therapy may have accounted for these differences. Hypoechoic splenic nodules in patients with HbSS have been described as splenic infarcts, abscesses or normal functioning splenic tissues. However, most splenic hypoechoic nodules seen in patients with HbSS have been reported to correspond to the normal functioning splenic tissues and tend to have a benign course with no need for further investigation for neoplastic transformation.39
This study also showed that the mean longitudinal and anteroposterior dimensions, as well as the median transverse dimension, splenic volume and splenic index, were significantly smaller in patients with HbSS compared to those of HbAA participants (p<0.05). These findings showed that splenic size in patients with HbSS tends to progressively reduce, due to repeated vaso-occlusion and infarction. The finding of this study is in contrast with previous study done in Nigeria by Akinlosotu et al,40 who found no significant difference in the median spleen size of patients with HbSS and those with HbAA. This may be due to variations in the make-up of study population. Akinlosotu et al40 worked exclusively in children while this study composed of both children and adult. Finding of their study may be due to the fact that splenic abnormalities in SCA tends to increase as age advances. Ezeike,41 reported no statistically significant difference between the splenic length and splenic transverse diameter of patients with HbSS and those with HbAA. He also found that the mean splenic volume and anterior posterior dimension of the spleen, were significantly higher in patients with HbSS than those with HbAA, contrary to the findings of this present study, for which no clear reason may be adduced for this rather unexpected variation. Contrasting finding was also reported by Olatunji et al,42 who found that the mean longitudinal and coronal dimensions of the spleen were higher in the HbSS patients compared with the control. The contrasting observation may be because majority of the participants in their study population were less than 20years of age.
Conclusion
This study showed significant difference in the splenic ultrasonographic findings between individuals with sickle cell anaemia and those with haemoglobin AA. Splenic size was significantly smaller in patients with sickle cell anaemia, compared with those with haemoglobin AA. Splenomegaly, autosplenectomy, and shrunken spleen, were found only in patients with HbSS. Only patients with sickle cell anaemia had abnormal splenic echopattern. There should be follow up of HbSS patients with ultrasonography, for early detection and prevention of splenic complications.
References
- Standring S. Gray Anatomy: The anatomical basis of clinical practice. 39th ed. Philadelphia: Elsevier Churchill Livinstone; 2008.pp 1239–1241.
- Brousse V, Buffet P, Rees D. The spleen and sickle cell disease: The sick(led) spleen. Br J Haematol. 2014; 166(1):165–176.
- Elsayes KM, Narra VR, Mukundan G, Lewis JS, Menias CO, Heiken JP. Imaging of the spleen: spectrum of abnormalites. Radiographics 2005; 25(4): 967-982.
- Adewoyin AS. Management of sickle cell disease: A review for physician education in Nigeria (Sub-Saharan Africa). Anemia. 2015; 2015: e791498.
- Isa H, Adegoke S, Madu A, Hassan AA, Ohiaeri C, Chianumba R, et al. Sickle cell disease clinical phenotypes in Nigeria: A preliminary analysis of the Sickle Pan Africa Research Consortium Nigeria database. Blood Cells Mol Dis. 2020; 84: 102438.
- Serjeant GR. The natural history of sickle cell disease. Cold Spring Harb Perspect Med. 2013; 3(1):1–11.
- Al-Salem AH. Splenic Complications of Sickle Cell Anemia and the Role of Splenectomy. ISRN Hematol. 2011; 2011: 1–7.
- Serjeant GR. The Spleen in Sickle Cell Disease. In: Bowdler A., editor. The Complete Spleen. Totowa, New york: Humana press; 2002. p. 251–252.
- Lonergan GJ, Cline DB, Abbondanzo SL. Sickle cell anemia. Radiographics. 2001; 21(4): 971-994.
- Adekile AD. Haemoglobinopathies. In: Azubuike, J.C; Nkanginieme K, editor. Paediatrics and Child Health In a Tropical Region. 1st ed. Owerri: African Educational services; 1999. p. 194–213.
- Asnani MR, Williams A, Reid M. Splenic enlargement in adults with homozygous sickle cell disease: The Jamaican experience. Hematology. 2013; 18(1):46–49.
- Lagundoye SB. Radiological features of sickle cell anaemia and related haemoglobinopathies in Nigeria. Afri J Med Sci. 1970; 1(3):315–342.
- Ezeofor SN, Obikili EN, Anyanwu GE, Onuh AC, Mgbor SO. Sonographic assessment of the normal limits of the spleen in healthy school children in South-East Nigeria. Niger J Clin Pract. 2014;17 :484–488.
- Ehimwenma O, Tagbo M. Determination of normal dimension of the spleen by ultrasound in an endemic tropical environment. Niger Med J. 2011; 52(3):198–203.
- Olaoye M. Research Methodology with statistics for health and social sciences. 1st ed. Ilorin: Nathadex publishers; 2004.p.116–125.
- Nnaji GA, Ezeagwuna DA, Nnaji IJF, Osakwe JO, Nwigwe AC, Onwurah OW. Prevalence and pattern of sickle cell disease in premarital couples in Southeastern Nigeria. Niger J Clin Pract. 2013;16: 309–314.
- Dick R, Watkinson A. The Liver and Spleen. In: Sutton D, editor. Textbook of Radiology and Imaging. 7th ed. London: Elsevier Churchill Livinstone; 2003. p. 737–786.
- Inah GB, Ekanem EE. Ultrasonographically Determined Autosplenectomy Rates In Nigerian Sicklers And The Predictors. IOSR J Dent Med Sci. 2018; 17(7): 61–64.
- Megremis SD, Vlachonikolis IG, Tsilimigaki AM. Spleen Length in Childhood with US: Normal Values Based on Age, Sex, and Somatometric Parameters. Radiology. 2004; 231(1): 129–134.
- Babadoko AA, Ibinaye PO, Hassan A, Yusuf R, Ijei IP, Aiyekomogbon J, Aminu SM, Hamidu AU. Autosplenectomy of sickle cell disease in zaria, Nigeria: an ultrasonographic assessment. Oman Med J. 2012; 27(2): 121 - 123.
- Luntsi G, Eze CU, Ahmadu MS, Bukar AA, Ochie K. Sonographic evaluation of some abdominal organs in sickle cell disease patients in a tertiary health institution in Northeastern Nigeria. J Med Ultrasound. 2018; 26: 31–36.
- Al-Salem AH, Al-Aithan S, Bhamidipati P, Al Jam’a A, Al Dabbous I. Sonographic assessment of spleen size in Saudi patients with sickle cell disease. Ann Saudi Med. 1998; 18(3): 217–220.
- Ryan S, McNicholas M, Eustace S. Anatomy for diagnostic imaging. 3rd ed. Edinburgh: Saunders; 2004. p.192.
- Gale HI, Bobbitt CA, Setty BN, Sprinz PG, Doros G, Williams DD, et al. Expected sonographic appearance of the spleen in children and young adults with sickle cell disease. J Ultrasound Med. 2016; 35(8):1735–1745.
- Quinn CT. Sickle cell disease in childhood. from newborn screening through transition to adult medical care. Pediatr Clin North Am. 2013; 60(6):1363–1381.
- Odunvbun M, Okolo A, Rahlmy C. Newborn screening for sickle cell disease in a Nigerian hospital. Public Health. 2008; 122(10):1111–1116.
- Chijioke A, Kolo PM. The longevity and clinical pattern of adult sickle cell anaemia in Ilorin. Eur J Sci Res. 2009; 32(4):528–532.
- Ezeike C, Ibewuike C, Okike C, Orji M, Uchendu E, Ugwu N. Doppler Sonographic evaluation of the Splenic artery among Sickle Cell Anemia Patients in a Nigerian Tertiary Health Institution. Int J Sci Res Publ. 2019; 9(11):143.
- McCarville MB, Luo Z, Huang X, Rees RC, Rogers ZR, Miller ST, et al. Abdominal ultrasound with scintigraphic and clinical correlates in infants with sickle cell anemia: Baseline data from the BABY HUG trial. Am J Roentgenol. 2011; 196(6):1399–1404.
- Kaushal DL, Verma DVK, Ahirwar DCP, Patil DA, Pratap Singh DS. Sonographic evaluation of abdominal organs in a sickle cell disease patient. Int J Med Res Rev. 2014; 2(3): 202–208.
- Abdullahi SU, Hassan-Hanga F, Ibrahim M. Ultrasonographic spleen size and haematological parameters in children with sickle cell anaemia in Kano, Nigeria. Niger Postgrad Med J. 2014; 21(2):165–170.
- Adekile AD, McKie KM, Adeodu OO, Sulzer AJ, Liu J, McKie VC, et al. Spleen in sickle cell anemia: comparative studies of Nigerian and US patients. Am J Hematol. 1993; 42(3): 316–321.
- Awotua-Efebo E, Alikor EA, Nwankwo NC, Nkanginieme KE. Haematological Indices and the Spleen in Stable Sickle Cell Anaemia Children and Haemoglobin AA Controls. West African J ultrasound. 2003; 4:16–19.
- Ojo O, Shokunbi W, Agunloye A. Splenic Size in Sickle Cell Anaemia Patients in a Tertiary Hospital. Niger Hosp Pract. 2014; 13(5–6):82–87.
- Christakis J, Hassapopoulou H, Papadopoulou M, Mandraveli K, Vavatsi N, Loukopoulos D, et al. Comparison of homozygous sickle cell disease in Northern Greece and Jamaica. Lancet. 1990; 335(8690): 637–640.
- Babadoko AA, Ibinaye PO, Hassan A, Yusuf R, Ijei IP, Aiyekomogbon J, et al. Autosplenectomy of sickle cell disease in Zaria, Nigeria: An ultrasonographic assessment. Oman Med J. 2012; 27(2):121–123.
- Forget BG, Franklin Bunn H. Classification of the disorders of hemoglobin. Cold Spring Harb Perspect Med. 2013; 3(2): a011684.
- Balci A, Karazincir S, Sangün Ö, Gali E, Daplan T, Cingiz C, et al. Prevalence of abdominal ultrasonographic abnormalities in patients with sickle cell disease. Diagnostic Interv Radiol. 2008; 14:133–137.
- Walker TM, Serjeant GR. Focal echogenic lesions in the spleen in sickle cell disease. Clin Radiol. 1993; 47(2): 114–116.
- Akinlosotu MA, Adeodu OO, Adegoke SA, Oseni SB, Ayoola OO. Fetal hemoglobin level and its relationship with spleen size and malaria parasite density in Nigerian children with sickle cell anemia. Ann Trop Med Public Heal. 2018; 11(4):133.
- Ezeike CI. Ultrasonographic Assessment of the Splenic Size in Sickle Cell Anemia : Single Splenic Span Measurement Vs Splenic Volume. Int J Res Sci Innov. 2019; 6(12): 77–83.
- Olatunji A, Olatunji P. splenic size determination in sickle cell anemia: an ultrasonographic study. East Afr Med J. 2001; 78(1): 366–369.