Making sense of a Holter electrocardiograph report
Kelechukwu Uwanuruochi K1, Eme O2
Abstract
Background: Holter monitoring has become available in more centres in sub-Saharan Africa in recent years, but the interpretation of Holter electrocardiogram (ECG) is poorly understood.
Material and method: We present a 71-year old man who presented with cardiac failure, had abnormal electrocardiogram and was sent for Holter monitoring. Our report aims to help physicians interpret a Holter ECG report.
Keywords: Making sense, Holter electrocardiograph, report
Introduction
Standard indications for Holter monitoring include.1,2 establishing the link between symptoms such as palpitations and chest pain with abnormal heart rhythms, diagnosis of the cause of syncope or near syncope, evaluation of transient arrhythmias, and stratifying the risk of sudden cardiac death. In recent times, indications have been expanded to include diagnosis and assessment of conduction abnormalities, stratification of certain cardiomyopathies, assessing the effectiveness of arrhythmia therapy and evaluation of silent ischemia and more complex analyses such as ST segment analysis, heart rate variability, signal averaged ECGs, diurnal QT and QTc analysis, obstructive sleep apnoea, vector-cardiography, T-wave alternans and heart rate turbulence.3
Abnormal findings on electrocardiogram including ventricular couplets, atrio-ventricular dissociation and intraventricular conduction block were the indication for Holter monitoring in our patient.
Case report
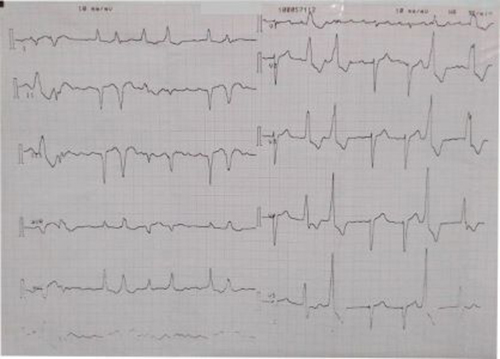
Figure 1: Electrocardiogram showing ventricular couplets, atrio-ventricular dissociation and intraventricular conduction block
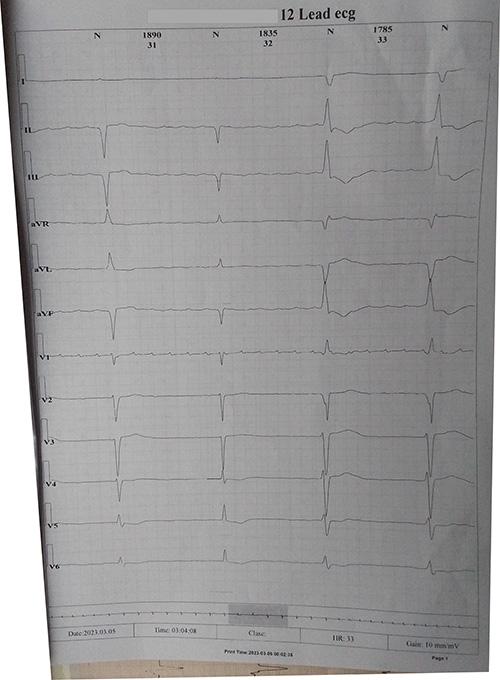
Figure 2: Holter electrocardiogram showing a run of bradycardia
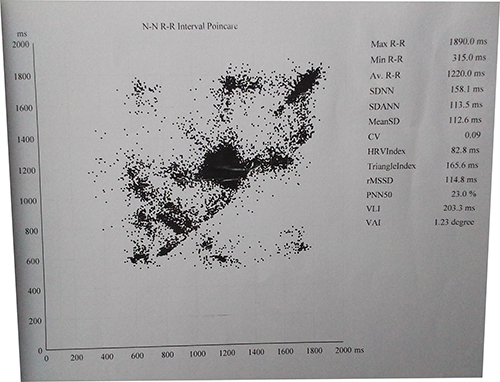
Figure 3: Heart rate variability display on holter
A 71-year-old male was seen in the clinic, with leg swelling, exertional breathlessness and paroxysms of nocturnal dyspnea for three weeks. He had hypertension for about thirty-four years, but was irregular with medications. His NYHA class was 3. His pulse rate was 62 beats per minute, irregularly irregular, blood pressure of 110/60 mm Hg. His apex beat was at sixth left intercostal space, mid-clavicular. First and second heart sounds were audible with a low-grade systolic murmur. Respiratory rate was 24/minute. He had coarse crepitations over the left lateral lung zone. The liver was palpable 4cm below the right costal margin, and ascites was demonstrated.
He was placed on Frusemide 40mg daily, spironolactone 25mg daily, lisinopril 10mg daily, metoprolol 25mg daily, digoxin 0.125mg daily. Investigations done included chest X-ray which showed severe cardiomegaly preponderantly left ventricular, with cardiothoracic ratio of 65%, aortic unfolding and prominent upper lobe vessels and mild left pleural effusion. A diagnosis of advanced hypertensive heart failure was made. Serum electrolytes/ urea/ creatinine were normal. 2D echocardiogram showed impaired left ventricular contractility, ejection fraction 19.9%, dilated left and ventricles, moderate aortic and tricuspid regurgitation, and pulmonary hypertension with mean pulmonary arterial pressure of 45mm/Hg. Full blood count and routine chemistry were unremarkable. Electrocardiogram showed ventricular couplets, atrio-ventricular dissociation and intraventricular conduction block (Figure 1). A Holter electrocardiograph was requested and showed findings summarized below:
Average heart rate was 51, minimum 35 and maximum 65. Total beats were 74169, with abnormal beats 7834 and permillage of 105. There was no pause beat with r-r >2000ms. Supraventricular beats were 1256, with supraventricular permillage of 16. Total supraventricular pair, bigeminy, trigeminy and runs were 56, 12, 5 and 66 respectively. Total ventricular beats were 6578, with ventricular permillage of 88. Total ventricular pair, bigeminy, trigeminy and runs were 215, 228, 35 and 270 respectively.
For heart rate variability, the SDNN, SDANN and rMSSD were 158.1, 113.5 and 114.8 ms respectively. PNN50 was 23.0% and CV 0.09.
Frequent episodes of severe bradycardia were seen. The total number of maximum ST episodes was not reported. Amiodarone 200mg twice daily, and valsartan-saccubitril 50mg twice daily, and Carvedilol 3.125 mg daily were added. The patient has been fairly stable on monthly follow up, which he does not keep religiously.
Discussion
On the Holter ECG report summary begins with the heart rate data. The average heart rate was 51 in our patient. Minimum HR was 35 and maximum HR 65. Total beats were 74169, with 7834 abnormal beats. Abnormal permillage was 105. He had about frequent episodes of sinus bradycardia. The reference ranges derived from a Japanese study of normal individual aged 60-89 is heart rate 73.8 ± 8, minimum HR 53.0 ± 6.0, maximum HR 121.1 ± 15.1 and total beats 103,693.1 ± 11,055.1.
There was no pause beat with RR >2000ms. Sinus pause >3 s and second-degree AV block (Mobitz) are suggest significant conduction abnormality.4
A total of 1256 Supraventricular ectopics (SVE) were recorded over 24 hours, 701 being single SVE, 112 coming from 56 supraventricular couplets, 37 from supra-ventricular bigeminy, 15 from trigeminy, and 391 from episodic run. Excessive supraventricular ectopic activity (ESVEA) have been defined as ≥ 30 SVE per hour or any episodic runs of ≥ 20 SVE5. They should be less than 1%, with total count of about 106 beats. Supraventricular ectopic activity were therefore excessive in our patient. ESVEA has been proposed as a surrogate marker for atrial fibrillation, stroke, and mortality.
Total ventricular ectopics over the twenty-four hour period was 6578. Frequent ventricular ectopic is defined as >7 PVC per minute (or less than 1% of total beats), or the presence of bigeminy, trigeminy, ventricular tachycardia, or fibrillation.6 This suggests significant risk of developing life-threatening arrhythmias in our patient.
Forty-six episodes of ST depression were noted on V6, with 30 episodes of ST elevation on V3. Significant ST-segment depression or elevation is defined as 1 mm (0.1 mV) ST-segment deviation occurring 80 ms after the J point, lasting for 60s.7
Interpretation of ST changes on Holter is challenging. While Holter is superior to resting electrocardiography, and has a higher sensitivity (77.78%) than thread-mill exercise test (TET), however the specificity of detecting CAD with TET is higher, as many daily events (such as standing, hyperventilating, eating, anxiety, taking drugs) may alter the S-T segment, giving false positives with Holter, so recorded S-T segment changes should be correlated with the patient's activities and episodes of chest pain.7 Ambulatory ECG is therefore of special value when the exercise test is equivocal or contraindicated. It is also of value in diagnosing ischemia when pain occurs at rest, during activities which cannot be reproduced on the treadmill, or nocturnally, as in Prinzmetal variant angina.8
Conditions precluding accurate interpretation of ST-segment activity include left ventricular hypertrophy, presence of a Q wave ≥0.04 seconds in a lead considered for monitoring, atrial fibrillation/flutter, use of digoxin or other medications known to affect ST-segment morphology, such as antidepressants, and left bundle branch block. In the presence of right bundle branch block, the frontal plane leads and the lateral precordial leads remain suitable for interpretation of ischemia.9
ST changes that indicate need for further evaluation of the coronary arteries include ST-segment elevation that is associated with angina, ST-segment depression associated with sinus tachycardia during exercise as well as new T wave inversion associated with inappropriate bradycardia. Holter monitoring is not reliable in investigating myocardial ischaemia in asymptomatic subjects without any known coronary artery disease10 as in our patient.
The Holter also reports heart rate variability, which reflects activity of sympathetic and parasympathetic nervous systems, decreased parasympathetic nervous systems activity or increased sympathetic nervous system activity resulting in reduced HRV. Time-domain indices of HRV quantify the amount of variability in measurements of the time period between successive heartbeats. The most commonly used index is the standard deviation of the mean normal RR intervals for 5-min segments (SDNN). SDNN estimates the standard deviation of the N-N intervals over 24 h, while SDANN reflects the standard deviation of the mean N-N intervals calculated in 5-min segments over 24-h. The N-N interval shows the R-R interval between consecutive QRS complex peaks during normal sinus rhythm. SDNN in our patient was 158.1 (129.9). Low HRV has been reported to suggest worse outcome in a variety of conditions such as myocardial infarction congestive heart failure and diabetic neuropathy.11,12 Based on 24 h monitoring, SDNN values above 100 ms is normal.13
Other time-domain measures of heart rate variability include standard deviation of 5-minute average NN intervals (SDANN), mean of the standard deviations of all NN intervals for all 5‐minute segments in 24 hours (ASDNN), square root of the mean of the squares of successive NN interval differences (rMSSD, the number of NN intervals differing by >50 ms from the preceding interval (NN50), the percentage of intervals >50 ms different from preceding interval (pNN50) and mean night R-R interval minus mean day R-R interval (Night-day difference).14
There are other measures of HRV under frequency domain. Heart rate (HR) oscillations are divided into ultra-low-frequency (ULF), very-low-frequency (VLF), low-frequency (LF), and high-frequency (HF) bands, the signal energy found within a frequency band being the power. Frequency-domain measurements estimate the distribution of absolute or relative power into the four frequency bands, e.g. ULF power is absolute power of ultra-low frequency band while HF power is absolute power of the high frequency band.14 Decreased HRV is a powerful ambulatory ECG predictor of cardiac mortality and malignant arrhythmias, however it has several limitations. It requires normal sinus rhythm. Atrial fibrillation, sinoatrial dysfunction, and >20% ectopic complexes preclude its use.14
The report can help the physician interpret a Holter ECG. We however observed the need for a standardized age related reference intervals in our environment.
References
- Giada F, Bartoletti A. Value of Ambulatory Electrocardiographic Monitoring in Syncope. Cardiol Clin. 2015 Aug;33(3):361-6. doi: 10.1016/j.ccl.2015.04.004. PMID: 26115822.
- Simon H, Schilling G. Indikationen zur 24stündigen EKG-Registrierung. Holter-Monitoring [Indications for 24-hour-ECG-registration. Holter monitoring]. Dtsch Med Wochenschr. 1980 Apr 11;105(15):522-5. German. doi: 10.1055/s-2008-1070700. PMID: 6988193.
- Mittal S, Movsowitz C, Steinberg JS. Ambulatory external electrocardiographic monitoring: focus on atrial fibrillation. J Am Coll Cardiol. 2011 Oct 18;58(17):1741-9. doi: 10.1016/j.jacc.2011.07.026. PMID: 21996384.
- Hashimoto K, Harada N, Kimata M, Kawamura Y, Fujita N, Sekizawa A, Ono Y, Obuchi Y, Takayama T, Kasamaki Y, Tanaka Y. Age-related reference intervals for ambulatory electrocardiographic parameters in healthy individuals. Front Cardiovasc Med. 2023 Mar 6;10:1099157. doi: 10.3389/fcvm.2023.1099157. PMID: 36950291; PMCID: PMC10026132.
- Nguyen TL, Thomas L. Supraventricular Ectopic Activity: When Excessive it is not all Benign! J Atr Fibrillation. 2010 Aug 23;3(2):307. doi: 10.4022/jafib.307. PMID: 28496666; PMCID: PMC4956355.
- Frolkis JP, Pothier CE, Blackstone EH, Lauer MS. Frequent ventricular ectopy after exercise as a predictor of death. N Engl J Med. 2003 Feb 27;348(9):781-90. doi: 10.1056/NEJMoa022353. Erratum in: N Engl J Med. 2003 Apr 10;348(15):1508. PMID: 12606732.
- Guirguis E. Holter monitoring. Can Fam Physician. 1987 Apr;33:985-92. PMID: 21263911; PMCID: PMC2218473.
- Kunkes SH, Pichard A, Meller J, Gorlin R, Herman MV, Kupersmith J. Use of the ambulatory ECG to diagnose coronary artery disease. J Electrocardiol. 1980 Oct;13(4):341-6. doi: 10.1016/s0022-0736(80)80085-9. PMID: 7430862.
- Stone PH. ST-segment analysis in ambulatory ECG (AECG or Holter) monitoring in patients with coronary artery disease: clinical significance and analytic techniques. Ann Noninvasive Electrocardiol. 2005 Apr;10(2):263-78. doi: 10.1111/j.1542-474X.2005.10203.x. PMID: 15842439; PMCID: PMC6932340.
- Crawford MH, Bernstein SJ, Deedwania PC, DiMarco JP, Ferrick KJ, Garson Jr A, Green LA, Greene HL, Silka MJ, Stone PH, Tracy CM. ACC/AHA guidelines for ambulatory electrocardiography: executive summary and recommendations: a report of the American College of Cardiology/American Heart Association task force on practice guidelines (committee to revise the guidelines for ambulatory electrocardiography) developed in collaboration with the north American society for pacing and electrophysiology. Circulation. 1999 Aug 24;100(8):886-93.
- Kleiger RE, Miller JP, Bigger JT Jr, Moss AJ. Decreased heart rate variability and its association with increased mortality after acute myocardial infarction. Am J Cardiol. 1987 Feb 1;59(4):256-62. doi: 10.1016/0002-9149(87)90795-8. PMID: 3812275.
- De Jong MJ, Randall DC. Heart rate variability analysis in the assessment of autonomic function in heart failure. J Cardiovasc Nurs. 2005 May-Jun;20(3):186-95; quiz 196-7. doi: 10.1097/00005082-200505000-00010. PMID: 15870589.
- Shaffer F, Ginsberg JP. An Overview of Heart Rate Variability Metrics and Norms. Front Public Health. 2017 Sep 28;5:258. doi: 10.3389/fpubh.2017.00258. PMID: 29034226; PMCID: PMC5624990.
- Kleiger RE, Stein PK, Bigger JT Jr. Heart rate variability: measurement and clinical utility. Ann Noninvasive Electrocardiol. 2005 Jan;10(1):88-101. doi: 10.1111/j.1542-474X.2005.10101.x. PMID: 15649244; PMCID: PMC6932537.